Training Performance Dashboard
A live view of my own running and CrossFit training, fed by a cloud pipeline that turns my Strava activities into training load, fitness and VDOT every night.
- Form (TSB)
- +3.9
- Neutral zone
- How ready I am to perform today
- Fitness (CTL)
- 52.3
- Six-week training load
- My long-term training base
- Fatigue (ATL)
- 48.4
- One-week training load
- How much recent training has taken out of me
- Running fitness (VDOT)
- 51.7
- Tempo run, 6 Oct 2026
- Higher means faster race times
Last update 20 Oct, 23:30 · Istanbul time, refreshed nightly
Right now: Fitness (52.3) and fatigue (48.4) are close, so form is +3.9: balanced, neither tired nor fully rested.
Dashboard
The activity filter applies to weekly load and heart rate.
Form & fitness
Fitness is training built up over about six weeks, fatigue is roughly the last week, and form is the difference: below zero means tired, above zero rested. Daily, from all training; not affected by the activity filter.
- Fitness (CTL)
- Fatigue (ATL)
Form (TSB) · the dot marks today
Weekly training load
How hard each week was: training load (TRIMP) from duration and heart rate, stacked by activity
- Running
- CrossFit
- Other
Weekly running distance
Kilometres per week, runs only
Pace trend
Average pace per week, runs only. Faster is higher.
Heart rate trend
Average heart rate per week, all activities, weighted by duration
VDOT history
A running fitness score from races, hard interval sessions and tempo runs; higher means faster. Shows all history; not affected by the filters.
- Race
- Interval session
- Tempo run
How points are chosen
I tag runs in Strava myself: Race for races I actually raced (not ones I paced), Workout for interval and tempo sessions. A race counts as it is. A workout counts only if its laps show the structure and its heart rate shows the effort: intervals need at least two reps of 2.5–6 minutes at ≥ 90% of my lactate-threshold heart rate; tempo needs at least 15 minutes in 10–40-minute blocks at ≥ 95%. Sessions recorded on automatic 1 km or 1 mile laps, and short reps under 2.5 minutes, are left out because they would overstate fitness.
- Training load starts on 1 Nov 2025, when heart-rate data became consistent.
- Activities recorded without heart rate count as zero load.

How it’s built
Strava and Garmin show single workouts well, but not how training load builds up across running and CrossFit, or whether I’m actually getting fitter. I wanted one view that answers both, built the way I’d build it at work.
The metrics
Five numbers drive the dashboard. Here is what each one means and what its abbreviation stands for.
- Fitness · CTL, Chronic Training Load
- The training base my body has adapted to. It’s a weighted average of my daily training load over roughly six weeks, so it climbs slowly through weeks of consistent training and fades slowly during breaks. A higher number means I can handle, and have been handling, more training.
- Fatigue · ATL, Acute Training Load
- How much the last few days have taken out of me. Same calculation over about one week, so it reacts fast: a hard week pushes it well above fitness, and a few easy days bring it back down.
- Form · TSB, Training Stress Balance
- Fitness minus fatigue: how ready I am to perform today. It is usually negative during a hard training block, which is expected, and turns positive after rest. Before a race the aim is slightly positive: fit, but not tired. Zones: fatigued below −30, optimal training −30 to −10, neutral −10 to +5, fresh above +5.
- Training load · TRIMP, Training Impulse
- The effort of a single session, calculated from its duration and how high my heart rate was.
- VDOT · Jack Daniels’ running fitness score
- Estimated from race results, hard interval sessions and tempo runs. Higher means faster; each value maps to predicted race times.
Architecture
A Python Cloud Function runs every night at 23:30 Istanbul time. It pulls my full Strava history, loads it into BigQuery as a fresh snapshot, computes daily metrics and publishes a small pre-aggregated JSON file. This page reads that file, so the site holds no credentials and a visit costs no queries.
Strava API
Source: my activities
Cloud Functions
Python, runs nightly at 23:30
BigQuery
Activities and daily metrics
This page
Reads a pre-aggregated JSON
- Python
- Google Cloud
- BigQuery
- Next.js
- Recharts
Key decisions
A full snapshot on every run instead of incremental merges, so edited or deleted activities are always picked up. A separate least-privilege service account for each job. A static JSON export instead of an API layer. Route and GPS data are never stored, and nothing public names an activity except races. If the nightly run fails, a Cloud Monitoring alert emails me.
Metrics and their limits
Training load is Banister TRIMP from heart rate; fitness and fatigue are its 42- and 7-day exponentially weighted averages, and form is the difference. VDOT comes from races and from interval and tempo sessions I tag as workouts in Strava, counted only when heart rate shows the effort was hard enough. TRIMP is only an approximation for CrossFit, and heart-rate coverage is reliable from November 2025 onwards.
How I checked the numbers
A metric I can’t check is just a number. I recomputed every session’s load with a second, independent model, heart-rate TSS based on my lactate-threshold heart rate, and compared the two. They agree closely: r = 0.955 per activity (0.975 for runs, 0.951 for CrossFit), and on 88% of days both put me in the same form zone, so the zone thresholds on this page hold for TRIMP.
For running fitness, my latest interval session (50.9), tempo run (51.7) and race (51.2) land within a point of each other. Garmin’s VO2max reads about 3 points higher after the same race. That is expected: Garmin estimates physiology, VDOT measures race performance, which is why this page calls it running fitness rather than VO2max.
What real data revealed
Automatic 1 km laps looked like intervals and had to be filtered out; requiring at least 90% of lactate-threshold heart rate separates real interval work from steady running. Short reps are left out on purpose: 400–800 m repeats are run faster than VO2max pace and would inflate the estimate. A single 210 bpm reading on a HIIT session was an optical-sensor spike, so maximum heart rate is set from the highest plausible value instead.
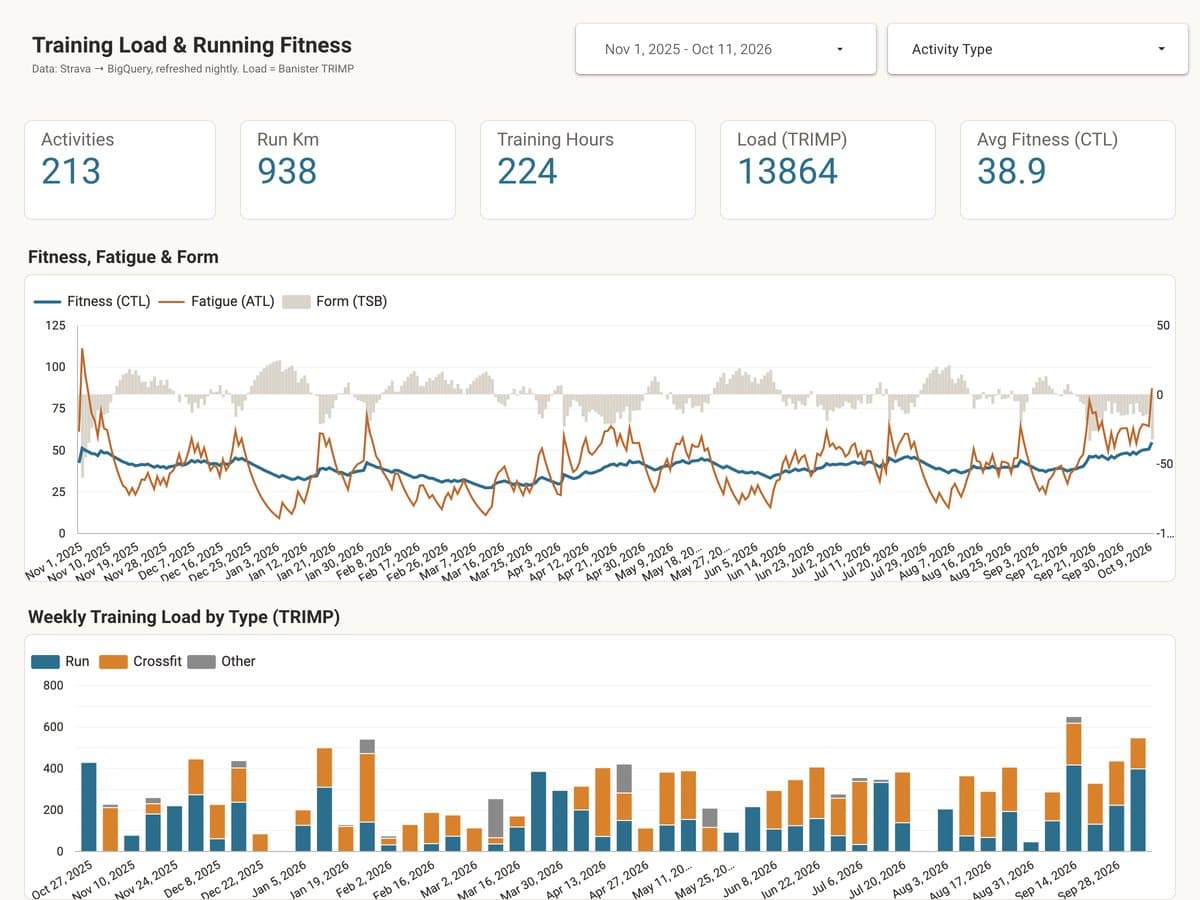
The same data in Looker Studio
The same BigQuery tables also feed a Looker Studio report, a second presentation layer built with a standard BI tool. It connects only to reporting views that expose safe columns, with no activity names or ids, so the privacy rules hold however the report is edited, and viewers cannot download the data. Where this page shows where I stand today, the report summarises whatever period you pick.